



When the Dashboard Stops Being Enough
Creator teams running content operations at scale have a shared frustration: the tools built to show them what happened rarely help them understand why it happened. Standard analytics dashboards deliver numbers in rows and columns, and those numbers either confirm what the team already suspected or raise questions the platform cannot answer. Narrative’s Visual Analytics approaches this problem from a different angle entirely, presenting performance data through visual story layers that are designed to surface patterns rather than just metrics.
Locker Room, which built its reputation as a collaboration-forward space where creator teams could review performance together and align on strategy, has been a natural home for teams that want context around their content decisions. But a growing number of creator operations are quietly migrating toward Narrative’s toolset, not because Locker Room failed them, but because visual analytics now does what collaborative review sessions used to do – and does it faster, without requiring everyone to be in the same meeting.
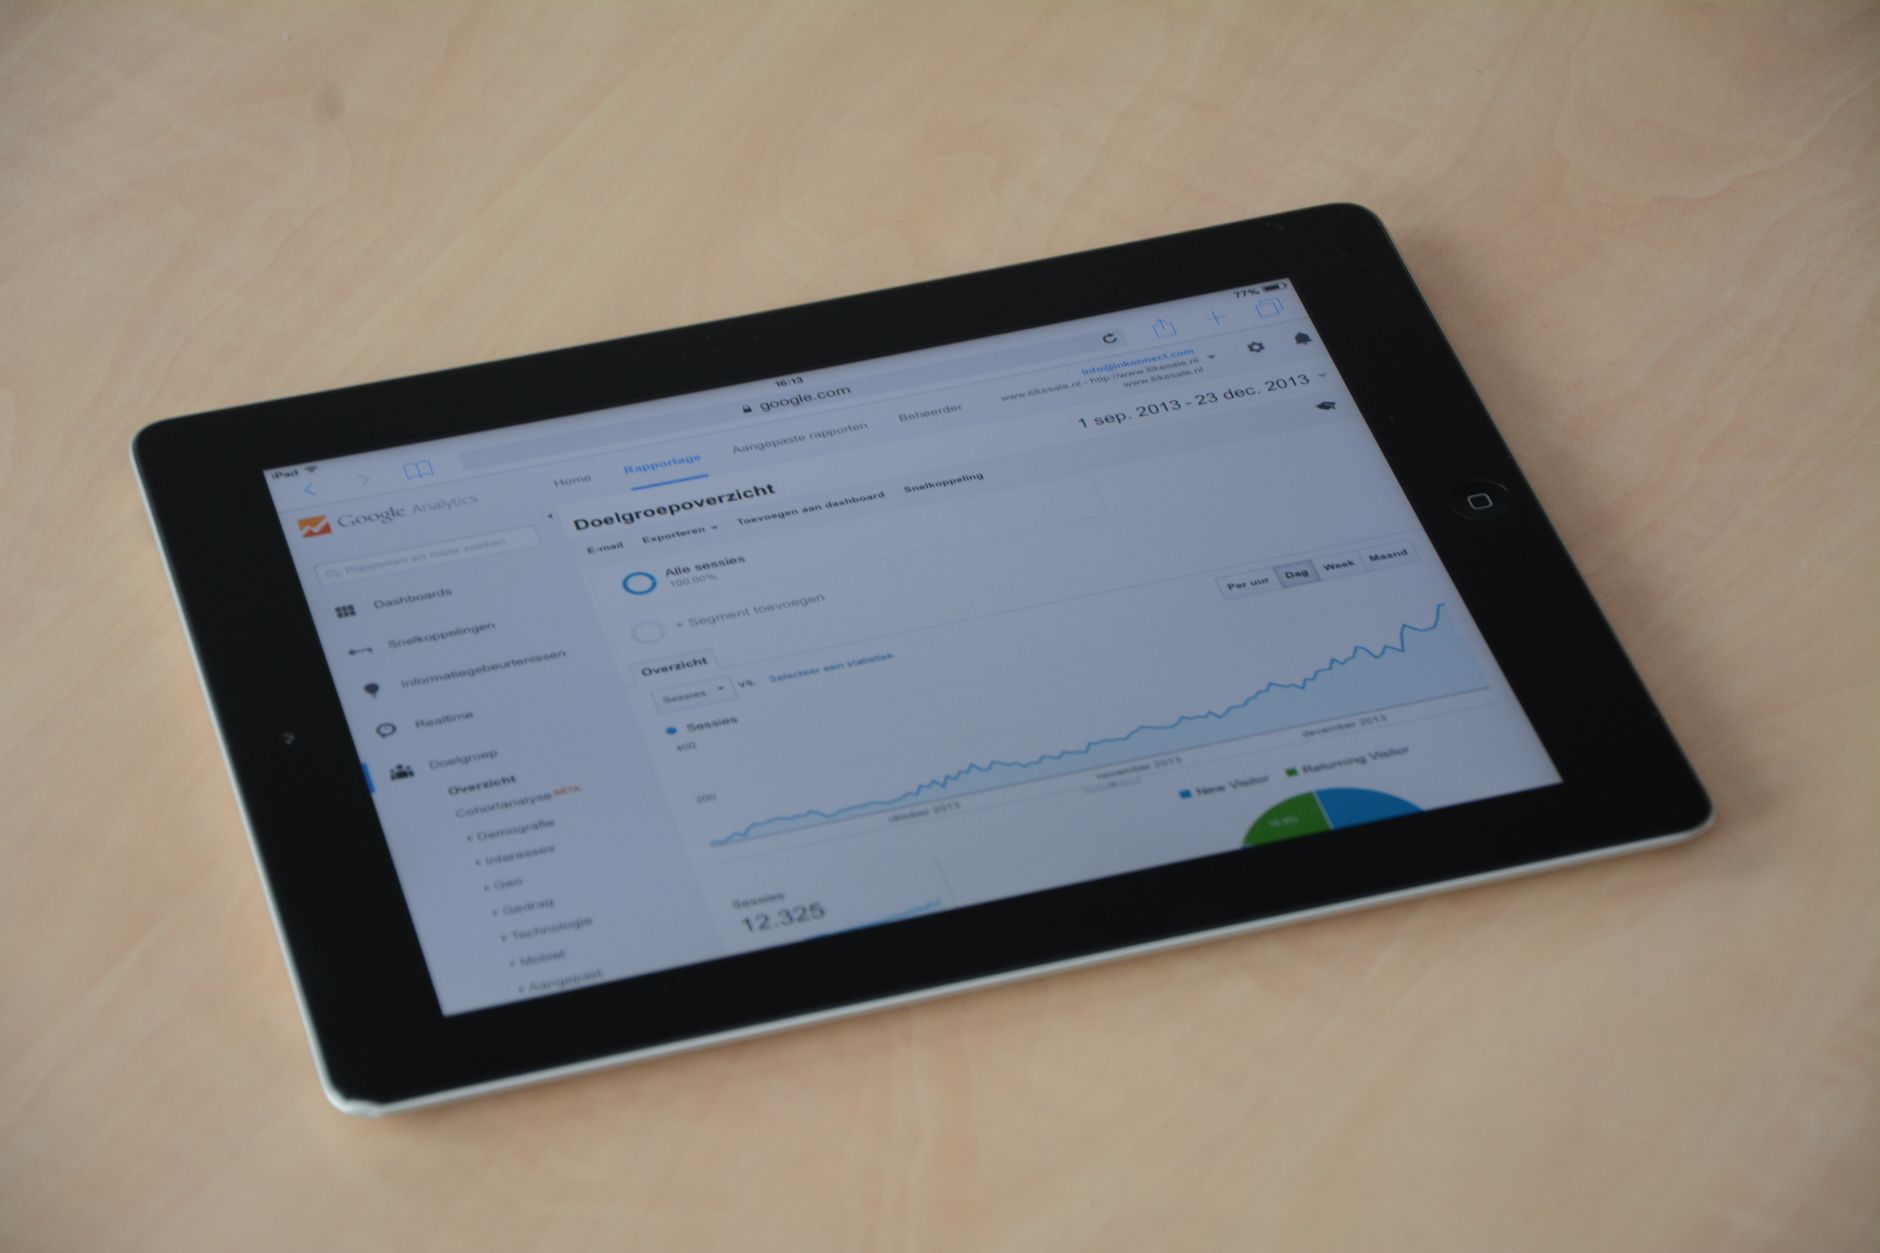
What Visual Analytics Actually Means in Practice
The phrase “visual analytics” gets used loosely across the marketing software space, often to describe nothing more than a bar chart with color. Narrative’s version is more specific. The platform maps content performance across time, format, audience segment, and distribution channel simultaneously, then renders those overlapping variables as layered visual patterns rather than separate data tables. A team can see, at a glance, whether a dip in reach is connected to a format shift, a posting-time change, or a specific platform’s algorithm behavior – without having to cross-reference three separate reports.
This matters enormously for creator teams, which often operate with a content calendar, a production workflow, and an analytics review running as three separate processes that rarely talk to each other. Narrative’s approach collapses that separation. The visual output directly reflects calendar and production variables, so the team is not just looking at performance outcomes – they are looking at performance in context of the decisions that produced it. That feedback loop closes much faster than it does in a traditional setup where someone exports data from one tool and pastes it into a shared document for the weekly review call.

The Locker Room Comparison Is Worth Unpacking
Locker Room built genuine loyalty. Its strength was always the asynchronous collaboration model – creators and managers could drop reactions, notes, and timestamp-specific comments directly on performance data, making the review process feel less like a quarterly audit and more like an ongoing conversation. For teams with strong communication habits, that model works well. For teams that are growing quickly, adding contractors, or operating across time zones, it introduces friction at exactly the moment when speed matters most.
Narrative’s Visual Analytics removes the conversation layer but replaces it with something that arguably communicates more. When the platform surfaces a visual cluster showing that short-form video content consistently outperforms long-form during the same posting window, that pattern does not need annotation. The team can see it, make a decision, and move forward without scheduling a review call or waiting for someone to write up their observations in a shared thread.
There is a real tradeoff here. Locker Room’s collaborative model produces qualitative insight – the kind that comes from someone on the team saying “I remember the week that graph dips, we changed our thumbnail style.” Narrative does not replicate that. What it offers instead is the ability to run visual comparisons across long time spans quickly enough that the team can generate their own qualitative hypotheses from what they observe. Whether that is a better workflow depends entirely on how the team is structured and what their decision-making process actually looks like day to day.
Creator teams that are content-studio-style operations – with dedicated strategists, editors, and performance analysts – tend to find Locker Room’s model more compatible with how they already work. Solo operators, small creator teams, and agencies managing multiple creator accounts tend to migrate toward Narrative because the visual layer does the analytical heavy lifting without requiring dedicated headcount to interpret it.
Where the Migration Is Happening
Agency-side teams managing creator rosters are among the earliest adopters of Narrative’s approach, and the reason is straightforward: they are running the same performance review process across multiple accounts simultaneously. Locker Room’s collaboration model is effective when the team and the creator are aligned in the same workspace, but it does not scale cleanly across a roster of ten or fifteen creators without creating organizational complexity. Narrative’s visual output can be shared with individual creators as a deliverable, which shifts the communication dynamic – instead of inviting the creator into a data review session, the agency sends a visual performance summary and the creator responds to it.
There is also movement at the brand-creator partnership level. Brands working with creator teams on long-running campaigns want reporting that is interpretable without training. A visual analytics output satisfies that requirement in a way that a Locker Room workspace does not, because the workspace assumes a level of familiarity with the platform’s interface that brand-side stakeholders often do not have.

The Quiet Part of “Quietly Replacing”
Migrations like this rarely announce themselves. Creator teams do not send out press releases explaining that they have switched analytics tools. What happens instead is that a team adopts Narrative for one workflow – campaign reporting, say, or weekly performance review – and Locker Room quietly stops being opened as often. Over a few months, the muscle memory shifts, and the older tool becomes something the team technically still has access to but no longer actively uses.
This pattern is worth watching because it signals something about where creator team infrastructure is heading. The demand is not for more features or more integrations. The demand is for tools that reduce the cognitive work required to go from data to decision. Visual analytics answers that demand more directly than collaborative annotation does, which is why the migration, even if quiet, is probably not going to reverse itself.
For teams still running their performance reviews inside Locker Room, the honest question is whether the collaboration model is genuinely accelerating decisions or whether it is providing the comfort of discussion without the speed of action. If a weekly review call still ends with someone saying “let’s pull more data before we decide,” the tool is not the problem – but switching to a visual analytics platform might make the problem harder to ignore.
Frequently Asked Questions
What makes Narrative’s Visual Analytics different from standard analytics dashboards?
Narrative layers time, format, audience, and channel data into visual patterns simultaneously, so teams can spot performance trends without cross-referencing multiple reports.
Is Narrative’s Visual Analytics better than Locker Room for all creator teams?
Not universally. Studio-style teams with dedicated analysts may prefer Locker Room’s collaborative model, while small teams and agencies tend to benefit more from Narrative’s visual approach.